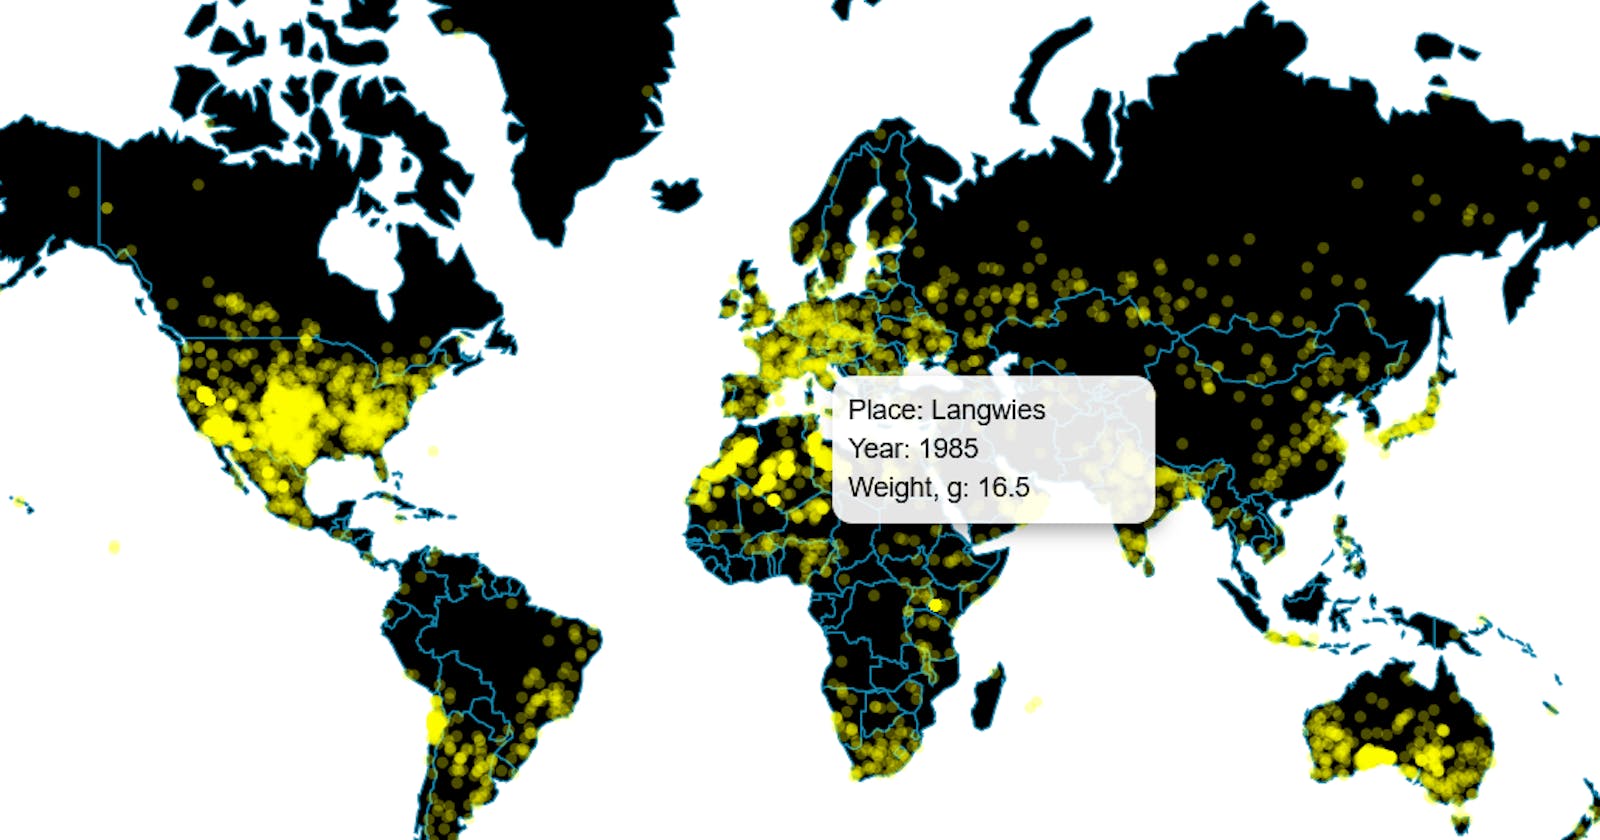
From last article you've already known how to create basic World Map and add points to this map according to dataset in d3.js.
From this article you will learn how to add HTML div tooltips to these points. Inside this tooltip I'll put information from dataset such as:
- place;
- year;
- weight.
In parenthesis of each step you will see type of file you need to work with - HTML, CSS or JS.
1(HTML). Add div with id "tooltip" and text-holders for each our future data in tooltip:
      <div id="tooltip">
            <text id="place"></text><br>
            <text id="year"></text><br>
            <text id="weight"></text><br>
      </div>
2(CSS). Create styles for div with id "tooltip" to be invisible by default:
#tooltip {
  position: absolute;
  width: 150px;
  height: auto;
  padding: 8px;
  background-color: white;
  border-radius: 10px;
  box-shadow: 4px 4px 10px rgba(0, 0, 0, 0.4);
  pointer-events: none;
  opacity: 0;
}

#tooltip text {
  margin: 0;
  font-family: sans-serif;
  font-size: 14px;
  line-height: 20px;
}
3(JS).
          .on("mouseover", function (event, d) {
            //Select hovering `circle` and fill it with black color
            d3.select(this).style("fill", "black");
            //Select HTML-tag with class "place" and add text for "place"
            d3.select("#place").text("Place: " + d.place);
            //Select HTML-tag with class "year" and add text for "year"
            d3.select("#year").text("Year: " + d.year);
            //Select HTML-tag with class "weight" and add text for "weight"
            d3.select("#weight").text("Weight, g: " + d.mass_g);
            //Select HTML-tag with class "tooltip"
            d3.select("#tooltip")
              //Apply left position + 10 px according selected `circle` for tooltip
              .style("left", `${event.layerX+10}px`)
              //Apply top position + 10 px according selected `circle` for tooltip
              .style("top", `${event.layerY+10}px`)
              //Displays an element as a block element, which starts on a new line, and takes up the whole width
              .style("display", "block")
              //Apply opacity for 90 %
              .style("opacity", 0.9);
          })
          //Add Event Listener | mouseout
          .on("mouseout", function (event, d) {
            //Give back color for unhovering `circle`
            d3.select(this).style("fill", "yellow");
            //Hide tooltip
            d3.select("#tooltip").style("display", "none");
          });
Whole code for this project you can find here
Useful resources which I was using making this article:
Murray Scott - Interactive Data Visualization for the Web
Visualize Data | Map Data Across the Globe - D3.js - FreeCodeCamp by Eleftheria Batsou
Special credits to Michael Rovinsky for helping with code issues
