
From last article you've already known how to create basic World Map in d3.js.
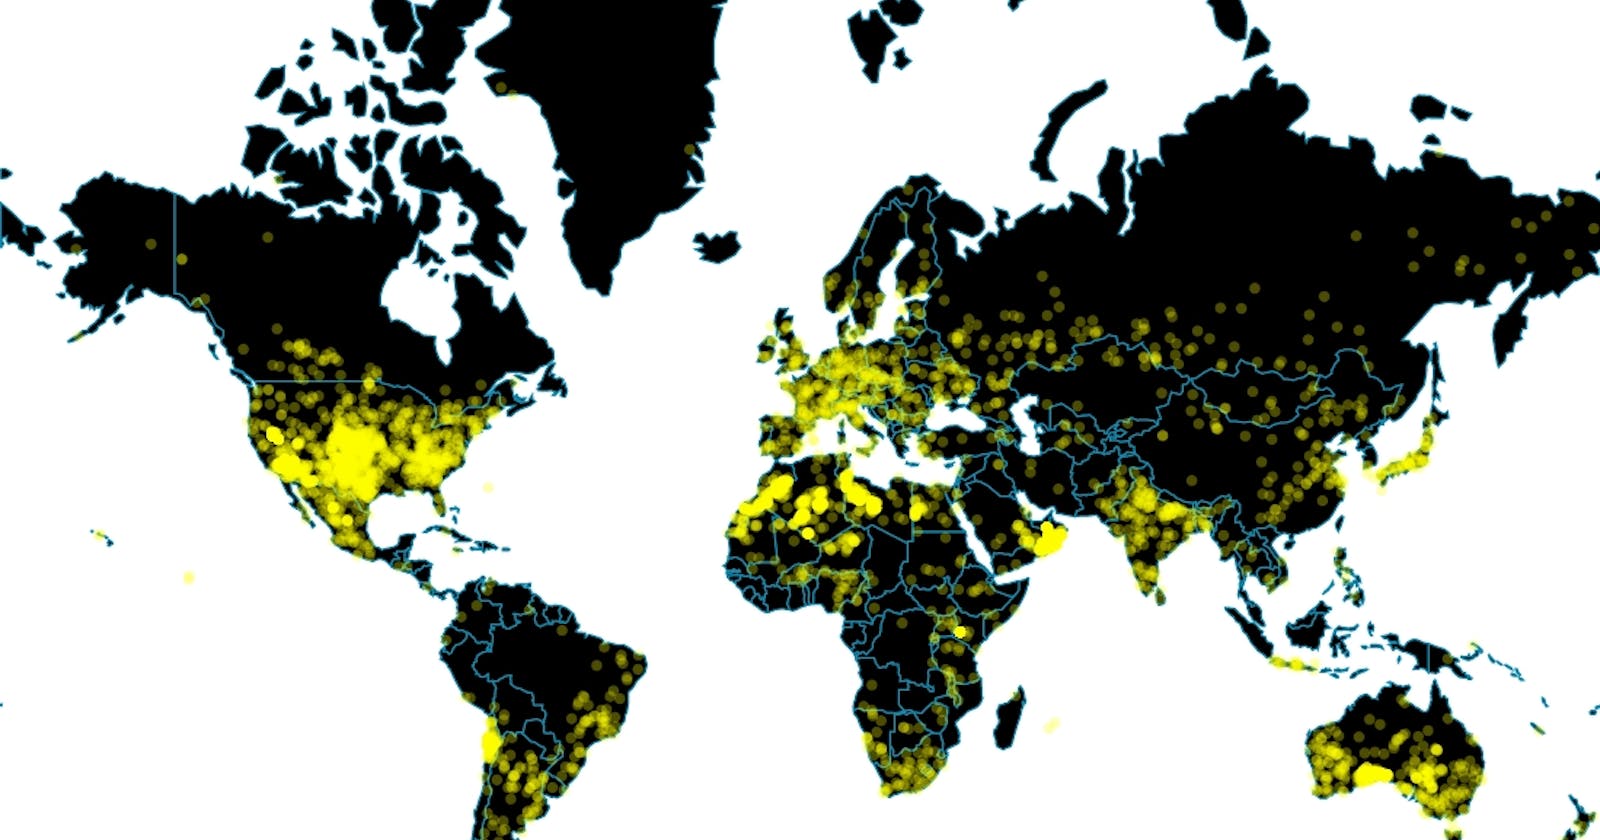
From this article you will learn how to add points to the map according to dataset.
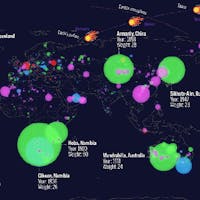
Today I'll use data for meteorite impacts for the period from 600 bce to 2012. There were more then 34 000 cases. You can find this data on the official website of The Meteoritical Society.
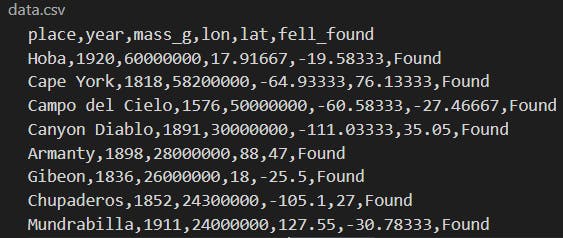
Structure of the data file:
 So you can see here such fields as:
- place - location name where meteorite impact was registered;
- year - year of impact registration;
- mass_g - meteorite's weight in grams;
- lon - location's longitude coordinate;
- lat - location's latitude coordinate;
- fell_found - whether meteorite was fell or found.
In parenthesis of each step you will see type of file you need to work with - HTML, CSS or JS.
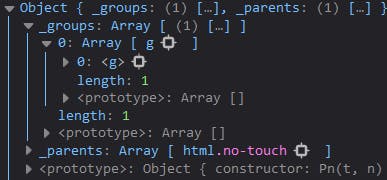
1(JS). Create g_points variable which will be grouping all the points that I have in svg:
var g_points = svg.append("g");
Output for g_points:
2(JS). Then I load data and setup render settings for it:
//Send http request to the url to load .json file and executes callback function with parsed json data objects
    d3.csv(
      "https://gist.githubusercontent.com/dsibi/626d88be4522b3afad12f73f0e7a78c1/raw/data.csv"
    )
      //When promise will fulfill successfully we can pass a function that accepts as input the data
      .then((data) => {
        //Select all future rendered `circle`-tags in the HTML document
        g_points
          .selectAll("circle")
          //Create placeholders for circles according to dataset
          .data(data)
          //Map data and placeholders for circles
          .enter()
          // Create `circle`-tags and add to the DOM
          .append("circle")
          //Assign X and Y coordinates accordind to dataset
          .attr("cx", function (d) {
            // Return an array [x, y] in pixels representing the projected point of the given point and take first element from the array for X-coordinate
            return projection([d.lon, d.lat])[0];
          })
          .attr("cy", function (d) {
            // Return an array [x, y] in pixels representing the projected point of the given point and take second element from the array for Y-coordinate
            return projection([d.lon, d.lat])[1];
          })
          //Specify raduis for the circles
          .attr("r", 3)
          //Give class `country` to `circle`
          .attr("class", "locations");
      });
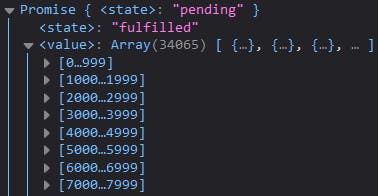
Output for d3.csv:
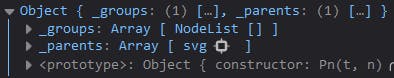
Output for .selectAll("circle"):
Output for .data(data):
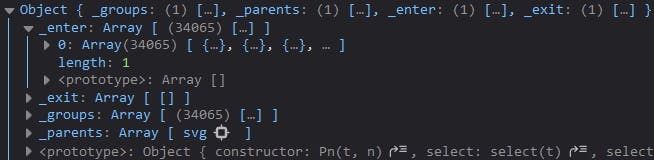
Output for .enter():
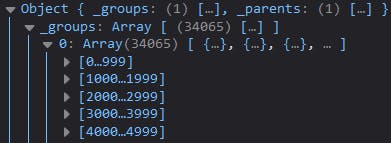
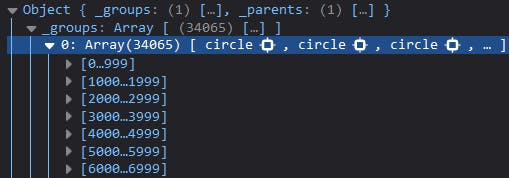
Output for .append("circle"):
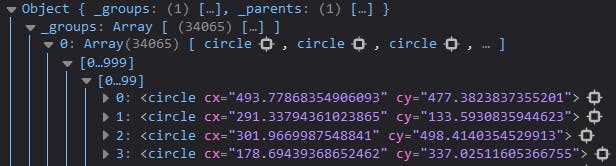
Output for .attr("cx", "cy"):
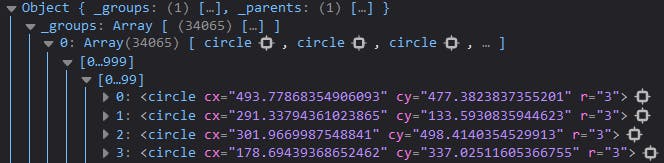
Output for .attr("r", 3):
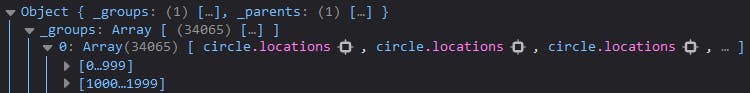
Output for .attr("class", "locations"):
3(CSS). Styles - final touch:
.country {
  fill:black;
  stroke: #118ab2;
}

.locations {
fill: yellow;
opacity: 0.3;
}
Whole code for this project you can find here
Useful resources which I was using making this article: