
Special credits for this article goes to video tutorial from FrontendTips
In this article I want to show step-by-step process of making basic map in d3.js.
I'll show and explain each line of the code you need for this and also will show you output in browser console for deep understanding of what is going on.
In parenthesis of each step you will see type of file you need to work with - HTML, CSS or JS
1(HTML). Create index.html and add d3-script:
<!DOCTYPE html>
<html lang="en">

<head>
    <meta charset="UTF-8">
    <meta http-equiv="X-UA-Compatible"
          content="IE=edge">
    <meta name="viewport"
          content="width=device-width, initial-scale=1.0">
    <title>Map in d3</title>
</head>

<body>
    <script src="https://d3js.org/d3.v6.min.js"></script>
</body>

</html>
2(JS/HTML). Create map.js and add it to index.html:
<script src="map.js"></script>
3(JS). Create variableswidth and height:
var width = 900;
var height = 600;
4(JS). Create SVG in variable:
var svg = d3
  //Returns 'body'-tag in the HTML document
  .select("body")
  //Create SVG element and add it at the end of 'body' element
  .append("svg")
  //Set width on 'body' element
  .attr("width", width)
  //Set height on 'body' element
  .attr("height", height);
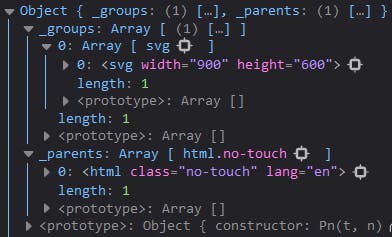
Output for svg:
 5.Map Loading
5a(HTML). Add TopoJSON library
My .json file has TopoJSON format that encodes topology:
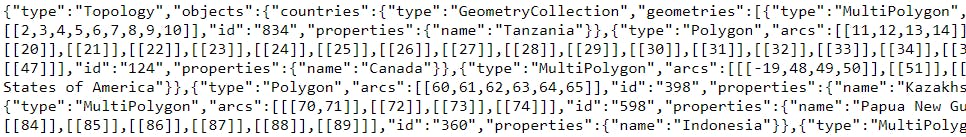
And as far as d3.js doesn't parse TopoJSON, but works with GeoJSON I need to convert data format in my .json file. For this I need to add library into index.html:
<script src="https://unpkg.com/topojson@3"></script>
5b(JS). Then I can create variables map and countries:
var map = d3
  //Send http request to the url to load .json file and executes callback function with parsed json data objects
  .json("https://cdn.jsdelivr.net/npm/world-atlas@2/countries-110m.json")
  //When promise will fulfill successfully we can pass a function that accepts as input the data
  .then((data) => {
    //Convert TopoJSON to GeoJSON and save new structure in variable `countries`
    var countries = topojson.feature(data, data.objects.countries);
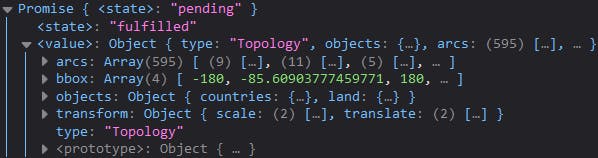
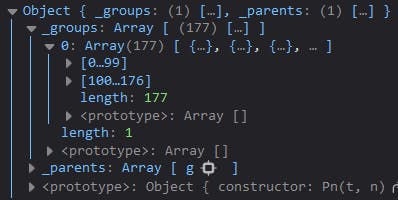
Output for map:
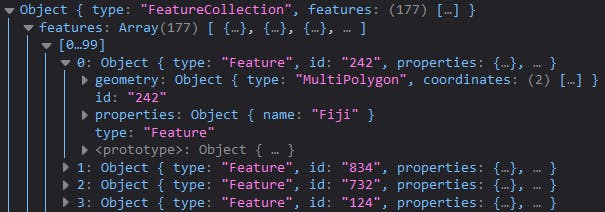
Output for countries:
6(JS). Create g variable which will be grouping all the paths of the countries that I have in svg:
var g = svg.append("g");
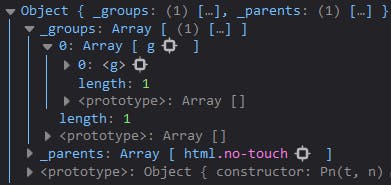
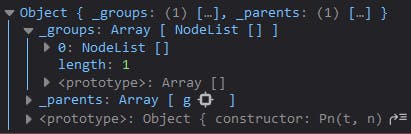
Output for g:
7(JS). Also for render map in d3 I need to add projection and path for mapping our data through geographic path generator:
//Create the Mercator projection from given json data
var projection = d3.geoMercator()
  // "zoom in" map
  .scale(140)
  // Set the projection’s translation offset to the specified two-element array [tx, ty] and returns the projection
  .translate([width / 2, height / 1.4]);
//The geographic path generator, it generates an SVG path data string
var path = d3.geoPath(projection);
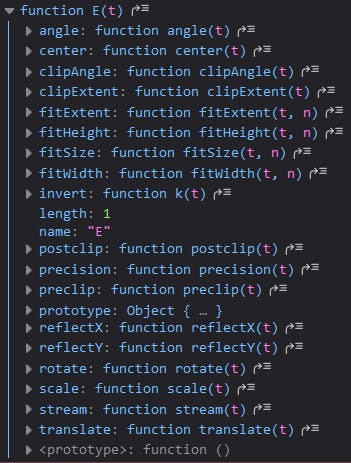
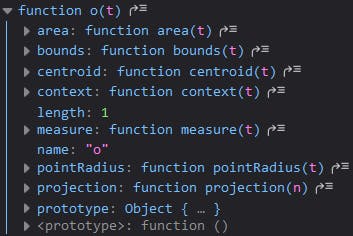
Output for projection:
Output for path:
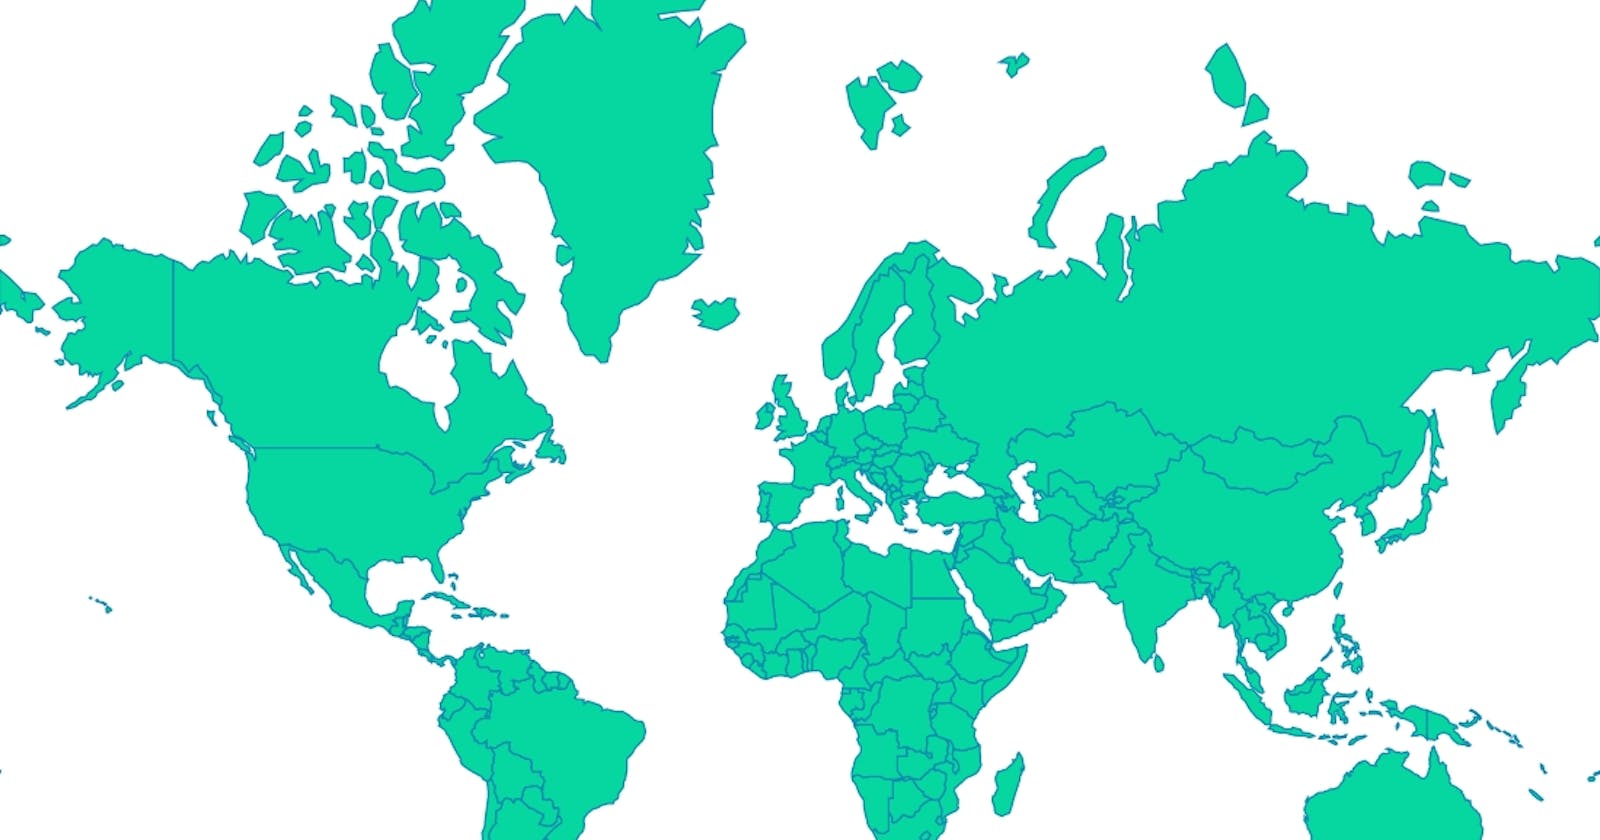
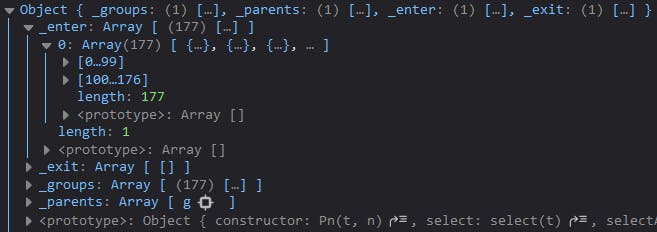
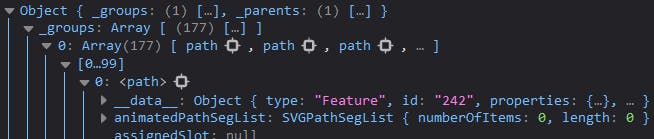
8(JS). Finally put everything together:
g.selectAll("path")
//Create paths placeholders according to dataset
.data(countries.features)
//Map data and paths placeholders
.enter()
// Create `path`-tags and add to the DOM
.append("path")
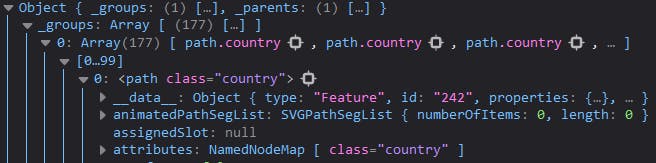
//Give class `country` to `path`
.attr("class", "country")
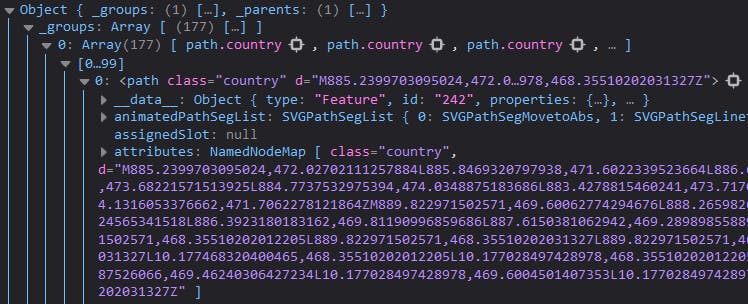
//Give an SVG path for each of the countries
.attr("d", path);
g.selectAll("path")
.data(countries.features)
.enter()
.append("path")
.attr("class", "country")
.attr("d", path)
9(HTML). A little fine-tuning within CSS, but first let me add it to index.html:
<link rel="stylesheet" href="style.css">
10(CSS).
.country {
  fill: rgb(48, 48, 48);
  stroke: #999;
}
Whole project you can find here
Useful resources which I was using making this article: