Efficient Way To Debug JavaScript in VS Code
No Extension Required

During my studies for the course JavaScript Algorithms and Data Structures I had to write a bunch of console.logs to check my code when my buddy, expert in IT, enlightened me to use internal debugging of Visual Studio Code.
It really makes my work much more efficient - you can check on the fly values of variables, go through your code execution line by line etc.
Here I give you easy plan of how to make it work based on Chrome browser without using any additional extensions.
🎯 Target: debug JavaScript code in VS Code
🛠️ Tools and prerequisites: VS Code, Chrome, html+js files of your app
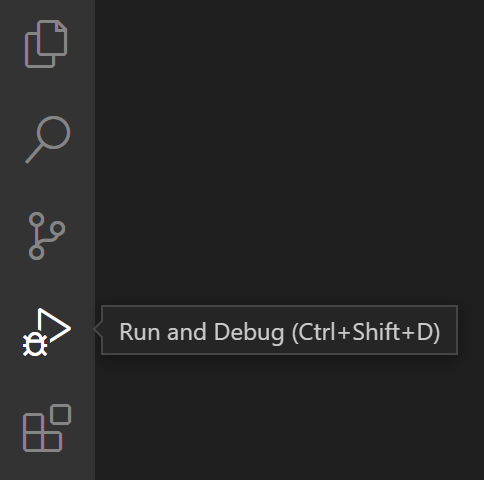
- To bring up the Run and Debug view, select the Run and Debug icon in the Activity Bar on the side of VS Code. You can also use the keyboard shortcut Ctrl+Shift+D.
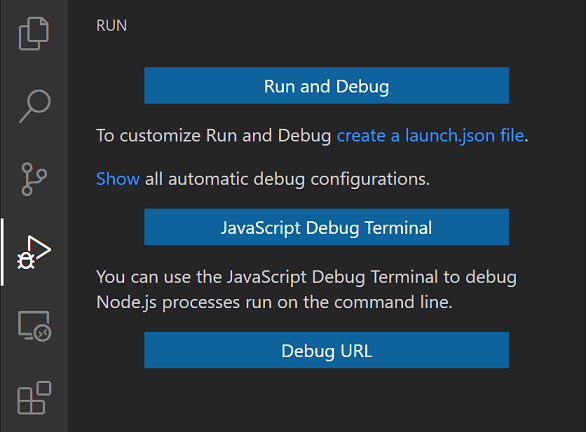
2 . To create a launch.json file, click the create a launch.json file link in the Run start view.
3 . Choose Chrome from the pop-up.
4 . launch.json file opens and here is the launch configuration you need:
{
    "version": "0.2.0",
    "configurations": [
        {
            "type": "chrome",
            "request": "launch",
            "name": "Launch Chrome against localhost",
            "url":"file://${workspaceFolder}/path-to-your-html-file/name.html",
            "webRoot": "${workspaceFolder}"
        }
    ]
}
That's it! Now all you have to do is to set breakpoints inside your js-code and check for it line by line.
You're welcome if you have any comments. Good debugging!🙂
Useful resources which I was using making this article:


